
The Balloon can in some cases travel quite far distances and so tracking the balloon needs to be as easy as possible. Much useful data, like GPS co-ordinates, speed and direction are already gathered. We also calculate and display the distance between the ground station and the payload. A graphical representation of the trek of the balloon and the position of the groundstation – a map – would be most helpful. This post describes the steps to accomplish this.
OpenStreetMap (http://wiki.openstreetmap.org/wiki/OpenStreetView) is a very good “free” mapping software that can be installed on a LINUX based system. First we needed to assess this piece of software and its suitability. It was initially installed on a Debian machine using a map that encompasses a fairly large area of the Cairns region, where all balloon trajectories are within. Initial testing suggested it should meet the requirements – it was highly functional and showed the main roads that would be traveled and the API DEV interface is well documented.
The installation process was replicated on a Beaglebone Black. Angstrom Linux was ditched in favour of Debian Linux. Additional space was required, so an 8GB microSD was inserted, formatted and mounted. I had to go through the whole slow process of compiling support for the RTC_DS3232 module and get wireless etc going. Because a lot of additional packages were required, many unrequired packages had to be removed.
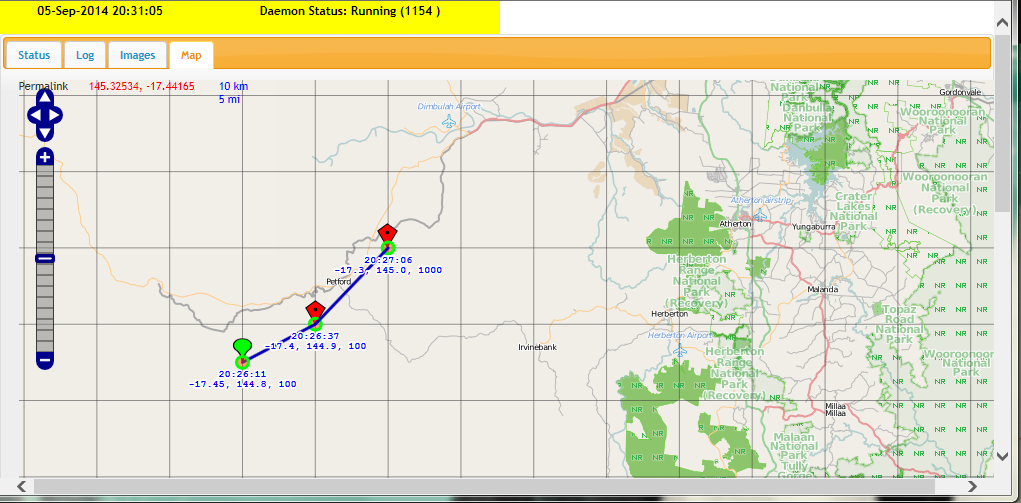
The result, a map that can be viewed offline and show all the waypoints of the balloon and the position of the groundstation when using a phone/pad device with built-in GPS. Below is a screenshot of it.
Here is an example with predicted flight path in red.
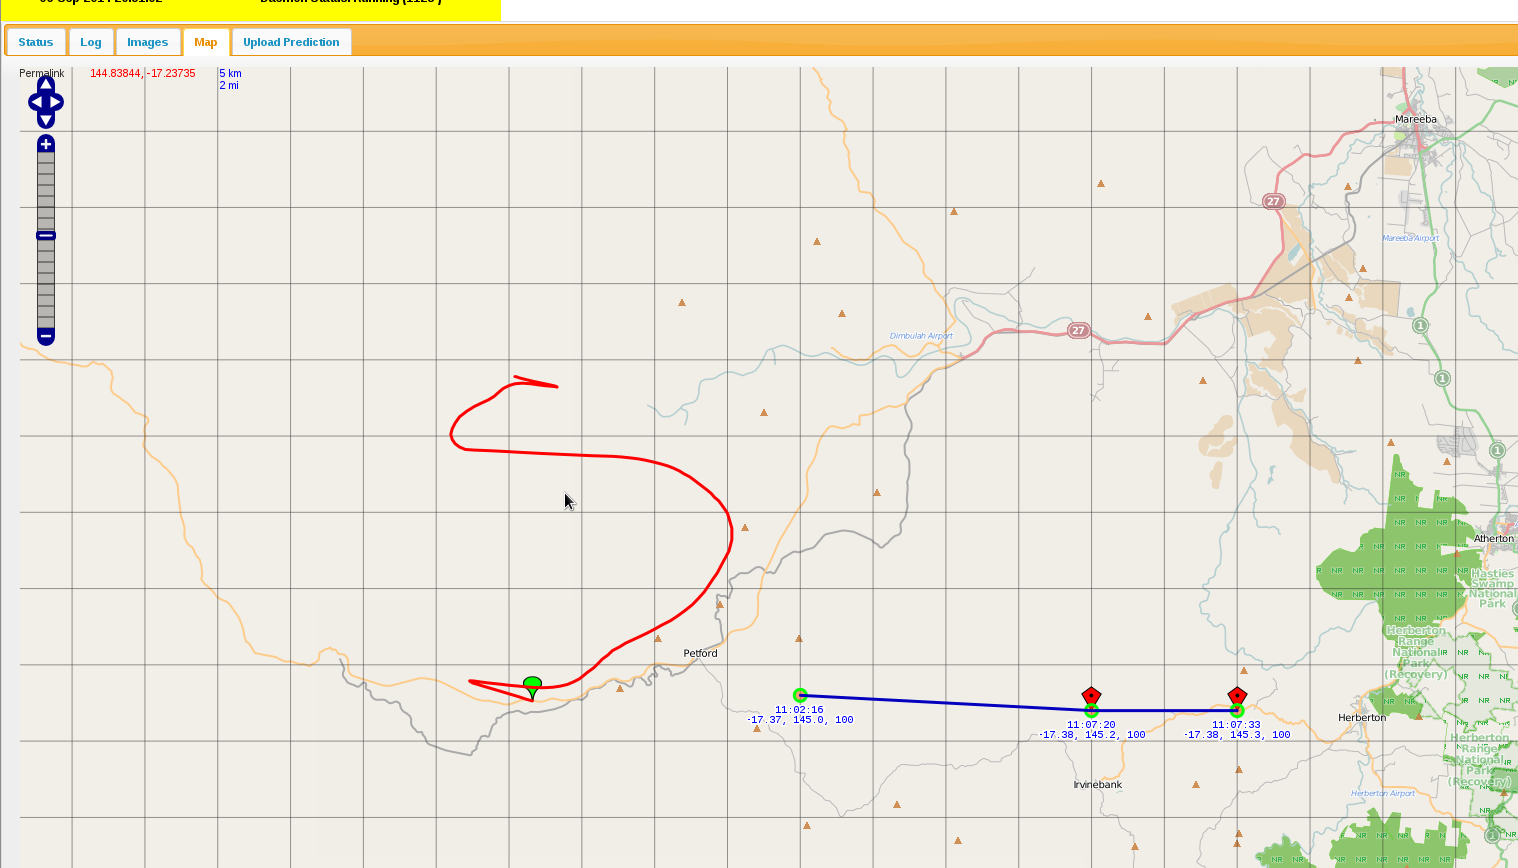
The interface has been written to show only way points for the current day. Red way points are for the balloon, except for the Green one which is the beginning one. A Blue point indicates the vehicle (when we have a GPS enabled device, e.g. an iPhone). Red path is the predicted flight path and can be generated by uploading a CSV file created on http://habhub.org/predict.
NOTE: We don’t have the blue icon here because this was done from a browser without a GPS device.
A line separates each balloon way-point and time/position are recorded against each way-point.
It can be a little slow at times, but when a map is generated and cached, when it is later recalled, things work relatively quickly. Definitely suitable for what we need it to do.